
The Metrics Dashboard
The Metrics Dashboard provides a centralized interface for monitoring and analyzing workflow executions and traces. It offers an aggregated view of execution metrics, including total requests, average duration, error counts, and latency percentiles. This tool enables users to ensure operational efficiency and traceability at the application, workflow, and execution levels through advanced visualizations and actionable insights.
1.Adding Metrics
Metrics are automatically generated for workflows that are published and deployed.
Execution Triggers
Use the test page in the platform for manual workflow execution.
Employ external tools like Postman or other API clients to trigger executions outside the platform.
Data Collection
Performance Metrics: Captures execution time and latency.
Error Tracking: Logs errors encountered during execution.
Input/Output Details: Records data passed through activities.
Processing and Availability
Metrics are processed upon execution completion and are typically available on the Metrics page within 60 seconds.
2.Metrics Retention Policy
Non-Production Environment: Metrics are stored for 7 days, focusing on short-term debugging.
Production Environment: Metrics are retained for 3 months to support long-term performance monitoring and optimization.
3.Application-Level Metrics
Displays aggregated data for all applications within a selected user workspace.
Columns
Application: Name of the application.
Average Duration (ms): Average response time per request.
Error Count: Total number of errors encountered.
Total Request: Count of requests processed.
Latency P99 (ms): 99th percentile latency.
Features
Filters: Search by application name, environment (Development/Production), or time range.
Pagination and Sorting: Customize the display with pagination options (10–100 rows per page) and sort by key metrics.

4.Workflow-Level Metrics
Provides workflow-specific metrics within an application.
Columns
Application: Parent application name.
Workflow: Workflow name.
Error Count: Total errors recorded.
Total Request: Total requests processed.
Latency P50 (ms): Median latency of requests.
Features
Filters: Filter workflows by name, environment, or time range.
Pagination and Sorting: Options to paginate and sort by metrics like Error Count or Latency.

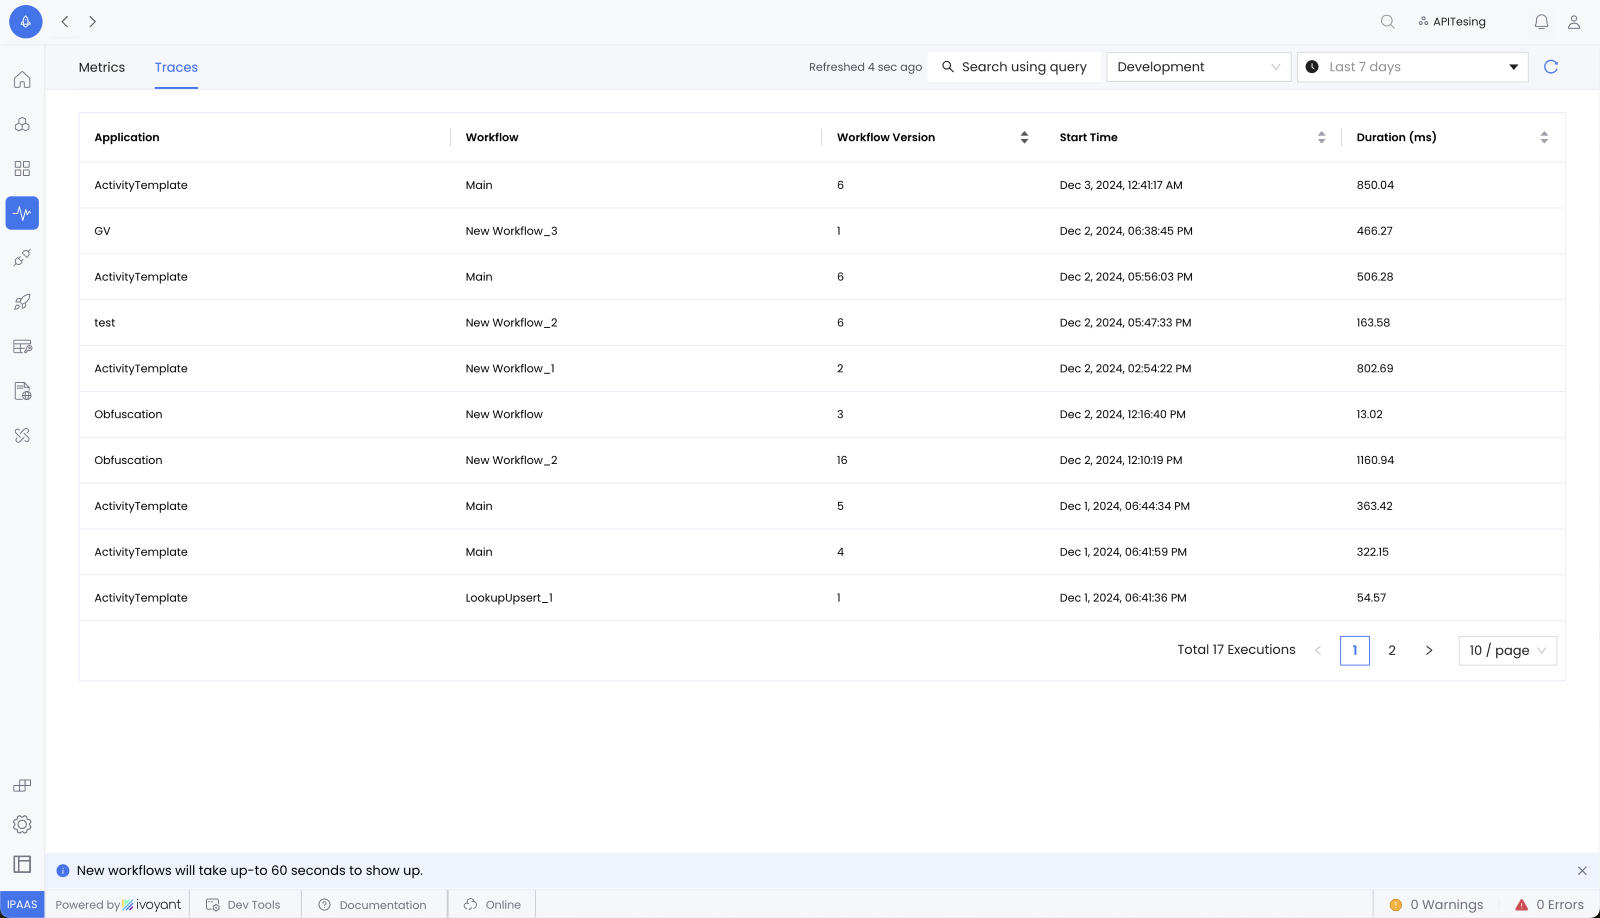
5.Workflow Executions
Details execution traces for selected workflows.
Columns
Application: Application name.
Workflow: Workflow name and version.
Start Time: Timestamp of execution start.
Duration (ms): Total execution time.
Features
Filters: Narrow down results by environment or time range.
Sorting: Arrange data by workflow version, start time, or duration.

6.Workflow Execution Trace
Provides an in-depth view of a single workflow execution.
Key Features
Execution Flow Diagram: Visualizes workflow execution paths.
Gantt Chart: Displays activity durations in milliseconds.
Activity Details: Execution time, input/output data, and subflow links.
Error Analysis: Displays error details for debugging and optimization.

Searching Traces in PlatformNX
PlatformNX allows users to search and filter traces for deeper insights into workflow execution and performance.
Steps to Search Traces
1. Access the Metrics Feature
Navigate to the Metrics section from the main menu.
Switch to the Traces tab.
2. Click on Search using query to open the query builder.
Select from the available preset attributes to define custom filters
Application Name
Workflow Name
Workflow ID
Workflow Version
Available Operators for Metrics Searchability
The following operators can be used to filter metrics. Each operator behaves as follows
EQUALS
Retrieves records where the selected attribute exactly matches the specified value.
Example: If attribute tag = status and search item = active, it returns records with status = active.
NOT EQUALS
Retrieves records where the selected attribute does not match the specified value.
Example: If attribute tag = status and search item = inactive, it excludes records where status = inactive.
IN
Retrieves records where the selected attribute matches any value from a list.
Example: If attribute tag = status and search item = [active, pending], it returns records with status = active or status = pending.
NOT IN
Retrieves records where the selected attribute does not match any value from a list.
Example: If attribute tag = status and search item = [inactive, archived], it excludes records with status = inactive or status = archived.
EXISTS
Retrieves records where the selected attribute is present, regardless of its value.
Example: If attribute tag = status, it returns all records where status is defined.
NOT EXISTS
Retrieves records where the selected attribute is absent or undefined.
Example: If attribute tag = status, it returns all records where status is not present.
3. View Results
Click Search to display traces matching your defined criteria.
Analyze trace details such as Application Name, Workflow Name, Workflow Version, Start Time, and Duration (ms)
Last updated
Was this helpful?